Monitoring
Monitor your GateKey infrastructure with the built-in dashboard, Prometheus metrics, and audit logs.
Real-Time Dashboard
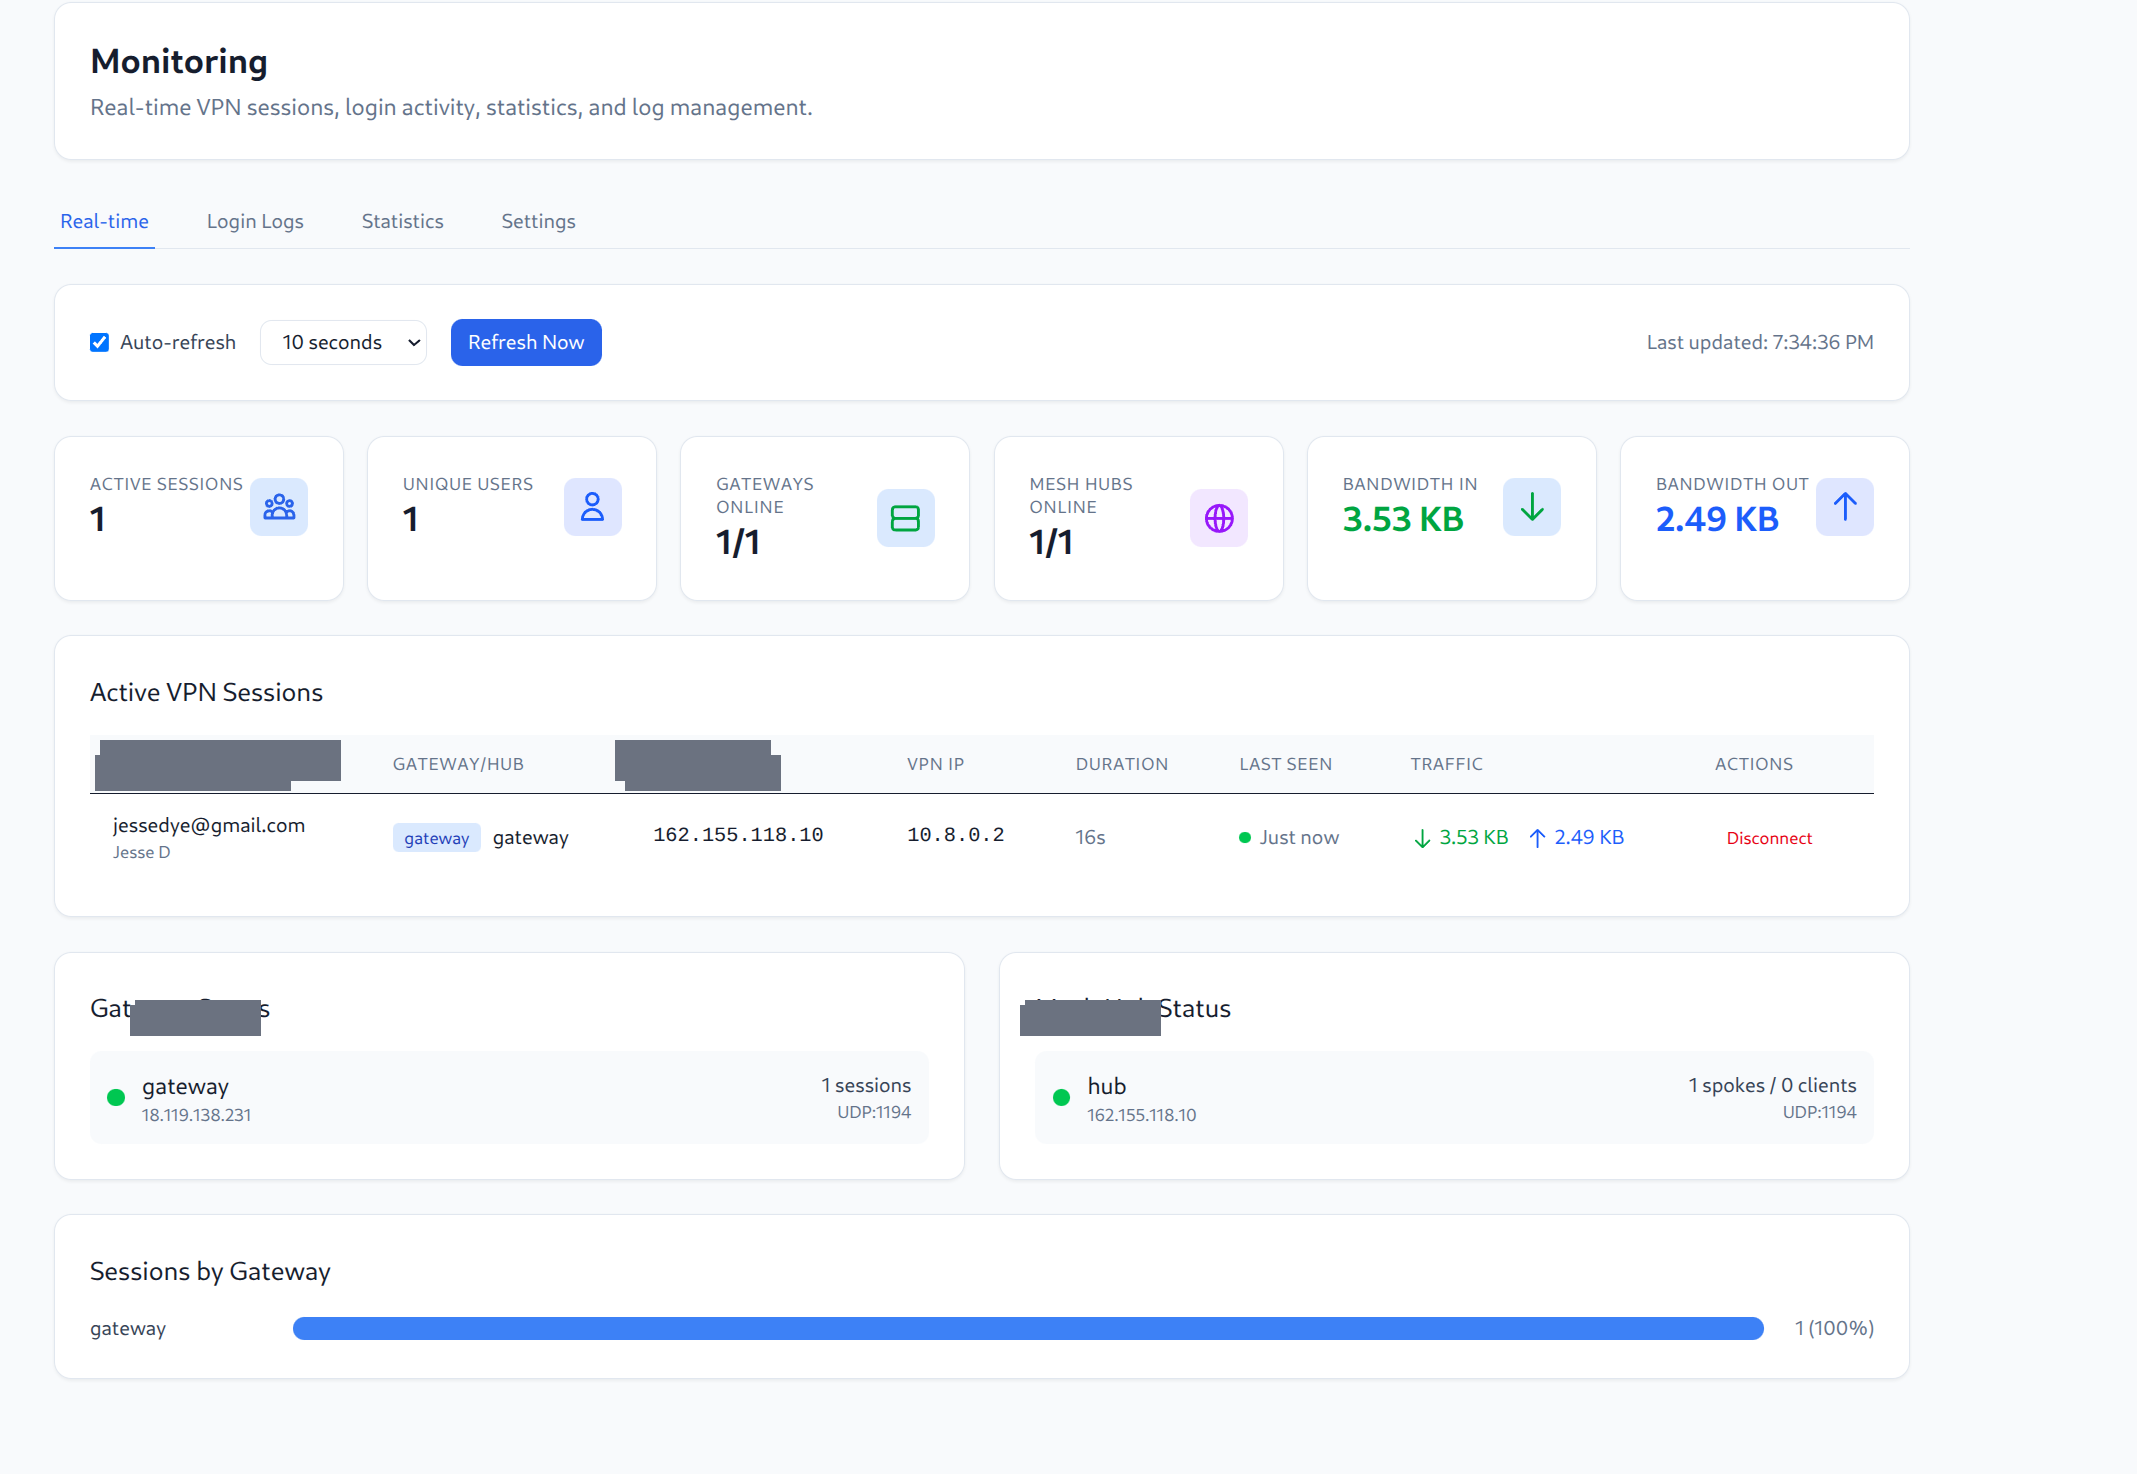
The monitoring page provides real-time visibility into your VPN infrastructure:
Key Metrics
- Active Sessions - Current number of connected VPN clients
- Unique Users - Number of distinct users connected
- Gateways Online - Health status of VPN gateways
- Mesh Hubs Online - Health status of mesh hubs
- Bandwidth In/Out - Real-time traffic statistics
Active VPN Sessions
View all currently connected users with:
- User identity (email)
- Gateway/Hub connection
- Client and VPN IP addresses
- Session duration
- Traffic statistics
- Ability to disconnect sessions
Gateway & Hub Status
Monitor the health of all gateways and mesh hubs with session counts and connection details.
Sessions by Gateway
Visualize session distribution across your VPN infrastructure.
Prometheus Metrics
GateKey exposes metrics at /metrics:
curl https://vpn.yourcompany.com/metrics
Available Metrics
| Metric | Type | Description |
|---|---|---|
gatekey_active_connections | Gauge | Current active VPN connections |
gatekey_auth_requests_total | Counter | Total authentication requests |
gatekey_auth_failures_total | Counter | Failed authentication attempts |
gatekey_configs_generated_total | Counter | VPN configs generated |
gatekey_gateway_heartbeats_total | Counter | Gateway heartbeats received |
Prometheus Config
scrape_configs:
  - job_name: 'gatekey'
    static_configs:
      - targets: ['vpn.yourcompany.com:8080']
Grafana Dashboard
Import the GateKey Grafana dashboard for visualizations.
Audit Logs
All security-relevant events are logged:
- User authentication (success/failure)
- Config generation requests
- Gateway connection attempts
- Access denials with reasons
- Rule changes
- Admin actions
Viewing Audit Logs
In the web UI:
- Navigate to Administration → Audit Logs
- Filter by:
- Time range
- User
- Action type
- Gateway
Log Levels
Configure in gatekey.yaml:
logging:
  level: "info"  # debug, info, warn, error
  format: "json"
  output: "/var/log/gatekey/server.log"
Alerts
Prometheus Alertmanager
groups:
  - name: gatekey
    rules:
      - alert: GatekeyAuthFailures
        expr: rate(gatekey_auth_failures_total[5m]) > 10
        for: 5m
        labels:
          severity: warning
        annotations:
          summary: High auth failure rate

      - alert: GatekeyGatewayDown
        expr: gatekey_gateway_status == 0
        for: 2m
        labels:
          severity: critical
        annotations:
          summary: Gateway offline
Health Checks
HTTP Health Endpoint
curl https://vpn.yourcompany.com/health
# {"status": "ok"}
Kubernetes Probes
livenessProbe:
  httpGet:
    path: /health
    port: 8080
  initialDelaySeconds: 10
  periodSeconds: 30

readinessProbe:
  httpGet:
    path: /health
    port: 8080
  initialDelaySeconds: 5
  periodSeconds: 10